User Interface
This is an overview of all the main UI features of Cute Plot. Cute Plot’s UI has been created from the ground up to be fast and intuitive for visualising power system output files.
If you think any areas of the UI could be improved, send us an email at support@cuteplot.com.
New to Cute Plot?
See the Quick Start for a guided walkthrough.
Main Interface Layout
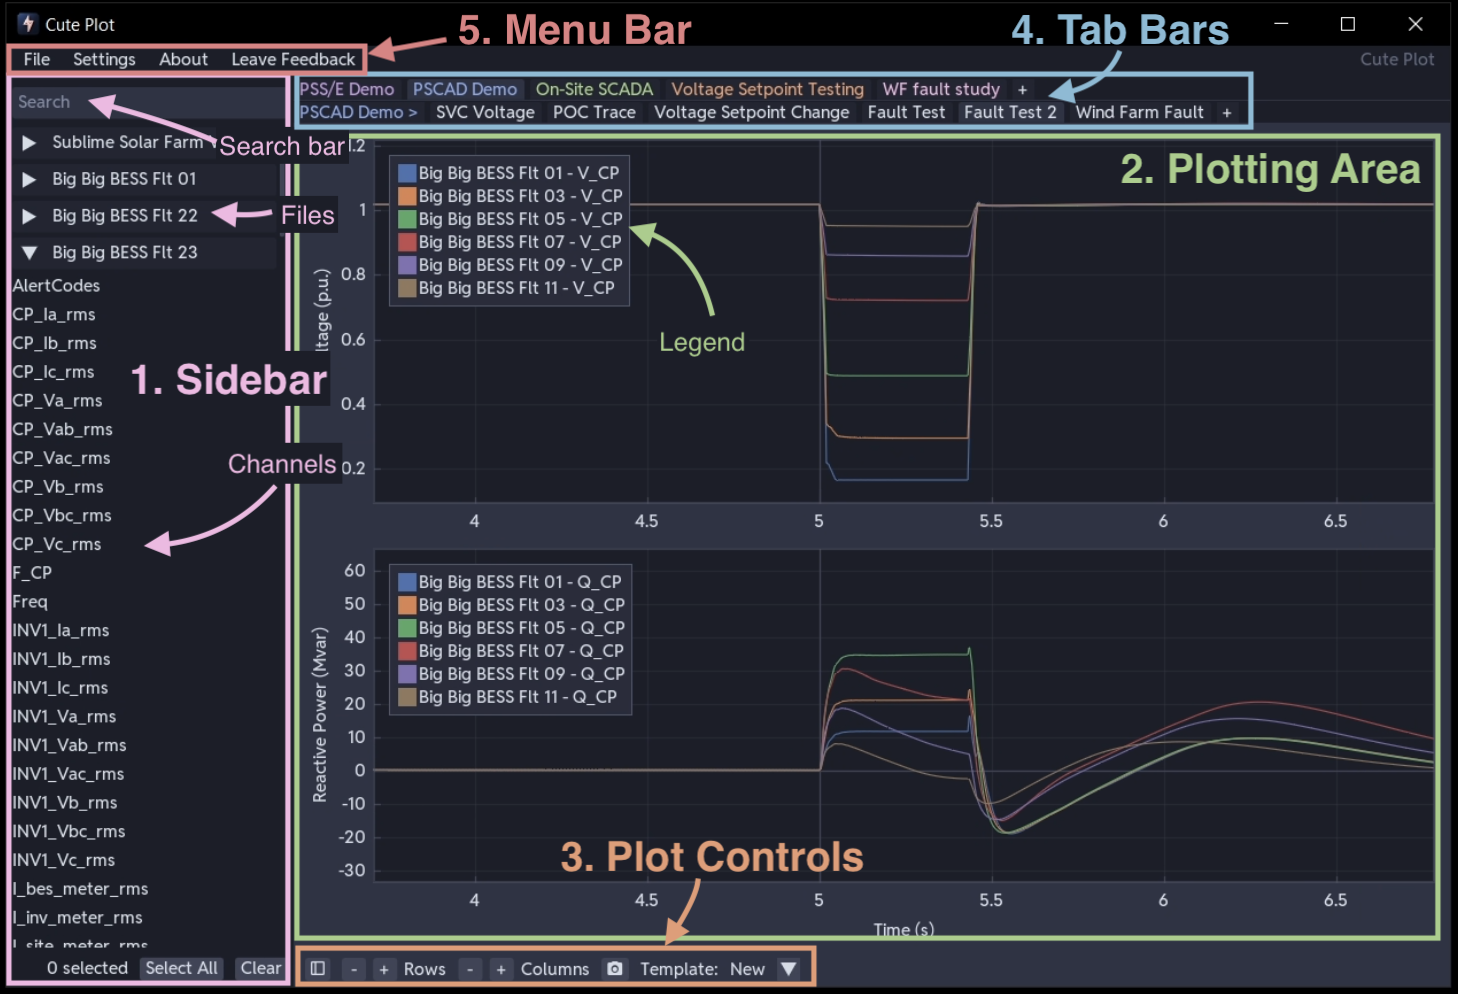
The window is organised into five areas:
- Sidebar (left) - loaded files, their series, and the search bar
- Plotting area (right) - the subplot grid
- Plot controls (bottom) - grid size, screenshots and templates
- Tab bars (top) - books and the plots within them
- Menu bar (top) - file operations and settings
1. Sidebar
Loaded files appear here. Each file is a collapsible header listing the series it contains.
File Search Bar
- Type to filter series by name
- Supports wildcards and boolean logic. See Search Function
- The ··· button next to it sorts the file list A-Z or Z-A, and opens the advanced search dialog
File Area
- File headers: one per loaded file. Click to expand or collapse
- Series: the individual data columns within a file
- Expand / Collapse: open or close every file header at once
2. Plotting Area
Subplot Grid
Each plot holds a grid of subplots, from 1x1 up to 5x3. The X-axes are synchronised, so zooming or panning one subplot updates the rest. Each subplot scales its Y-axis independently. See Plotting & Navigation.
Legend
The legend lists the series drawn in each subplot. Right-click a legend entry to:
- rename the series
- apply transformations. See Data Transformations
- add a confidence band
- remove the series from the subplot
3. Plot Controls
Row and Column Steppers
- Rows: ± buttons setting the number of subplot rows, from 1 to 5
- Columns: ± buttons setting the number of subplot columns, from 1 to 3
Screenshot Tool
Captures the current plot view as a timestamped PNG and copies it to the clipboard.
Template System
Gives quick access to saved templates. Dropping a file onto a templated plot distributes its series across the subplots by pattern. See Templating System.
4. Tab Bars
Tabs come in two nested layers:
- Books: hold any number of plots
- Plots: each has its own subplot grid, series and settings
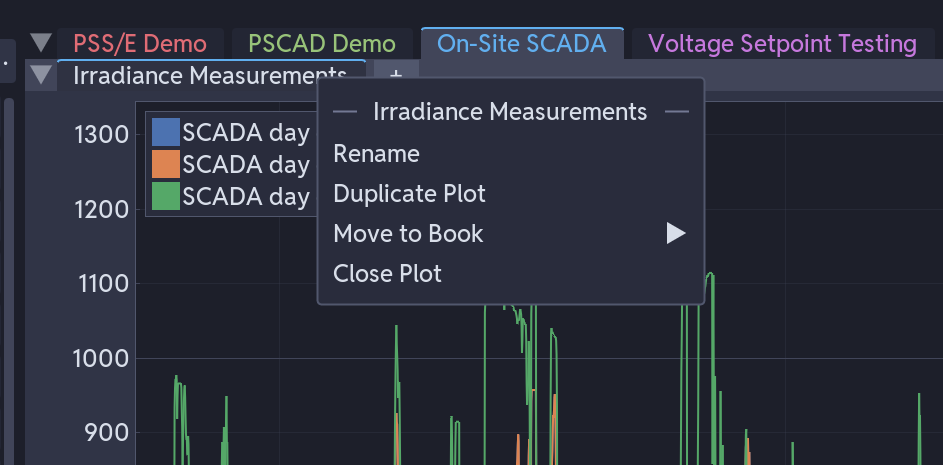
Drag tabs to reorder them, click + to add a plot or book, and right-click a tab for:
- Rename
- Duplicate Plot / Duplicate Book - copies it, including its series, transformations and templates. Duplicating a book copies every plot inside it
- Move to Book - moves a plot into another book (plot tabs only)
- Close Plot / Close Book
5. Menu Bar
File Menu
| Item | What it does |
|---|---|
| New Workspace | Clears everything and starts a fresh, untitled workspace |
| Open Workspace... | Loads a .cuteplot workspace file |
| Save Workspace | Saves to the current workspace file, or prompts for a location the first time |
| Save Workspace As... | Saves a copy under a new name or location |
| Open Data Files... | Loads CSV, Excel, Parquet, PSCAD or PSS/E files into the current workspace |
| Purge Unused Data Files | Closes every loaded file that isn't plotted anywhere, to free memory |
A .cuteplot workspace file is self-contained: it holds the loaded data itself, not just a reference to it, plus every book, plot, series, transformation, annotation and template association. New Workspace and Open Workspace... both prompt you to save first if there are unsaved changes.
Edit Menu
Undo and Redo, labelled with the action they affect, such as "Undo Add vertical line". Greyed out when there is nothing to undo or redo. History is kept per plot tab and cleared when the tab closes.
Settings Menu
Query Options
Choose which statistics the query rectangle calculates. See Query & Analysis Tools.
Plot Types
Switch between plot types. Time series and datetime plots are supported.
Updates
Check for and download updates, and change how Cute Plot checks for them.
Preferences
Opens the Preferences window, covering theme, screenshot folder, date/time formats, plotting performance, live-reload behaviour and more. See Settings & Configuration.
About Menu
- Application version and system information
- Licence Information: your current licence status
Mouse and Keyboard Interactions
File Area
| Action | Effect |
|---|---|
| Single click | Select a file or series |
| Ctrl+click | Add or remove one series from the selection |
| Shift+click | Select a range of series |
| Right-click a file | File context menu (rename, template, export, close) |
| Right-click a series | Rename it in place |
| Drag and drop | Move series onto a plot |
Plot Area
| Action | Effect |
|---|---|
| Mouse wheel | Zoom in and out |
| Left mouse + drag | Pan |
| Hover axis + scroll | Lock the opposite axis while zooming |
| Right-click | Context menu |
| Right-click + drag | Zoom rectangle |
| Ctrl+click + drag | Query rectangle |
| Middle mouse + drag | Query rectangle |
| Drag series from sidebar | Add the series to a subplot |
Series Legend
| Action | Effect |
|---|---|
| Drag from legend | Move the series to another subplot |
| Right-click | Rename, transform, add a confidence band, or delete the series |
Keyboard Shortcuts
| Shortcut | Action |
|---|---|
| Ctrl+Z | Undo |
| Ctrl+Y | Redo |
| Ctrl+N | New workspace |
| Ctrl+O | Open workspace |
| Ctrl+S | Save workspace |
| Ctrl+Shift+S | Save workspace as |
| Ctrl+T | New plot tab |
| Ctrl+W | Close the active plot tab |
| Ctrl+Tab / Ctrl+Shift+Tab | Next / previous plot tab |
| Ctrl+- , Ctrl+I, Ctrl+L, Ctrl+P | Add a horizontal line, vertical line, linked vertical line or text label at the cursor (plot hovered) |
The workspace and undo/redo shortcuts are also shown next to their matching items in the File and Edit menus.
Context Menus
Plot Right-Click Menu
- Add Annotations: horizontal line, vertical line, linked vertical line or text label
- Analysis Module: attach Rise & Settling Time or FFT Analysis to the subplot
- Edit Title / Edit Y-Axis Label: rename the subplot or its axis
- Show Legend: toggle the subplot's legend
See Plotting & Navigation for what each option does.
File Right-Click Menu
- Rename: changes the display name only
- Create Plot from Template: applies a saved template to the file in a new plot tab
- Export File: saves the file's data to
.csvor.parquet - Close File: removes the file and its series from the session