Annotations
Cute Plot supports annotations for you to point out relevant findings, quickly, to present to others. If you can think of other annotations that could be helpful, please email us at support@cuteplot.com.
Annotation Types
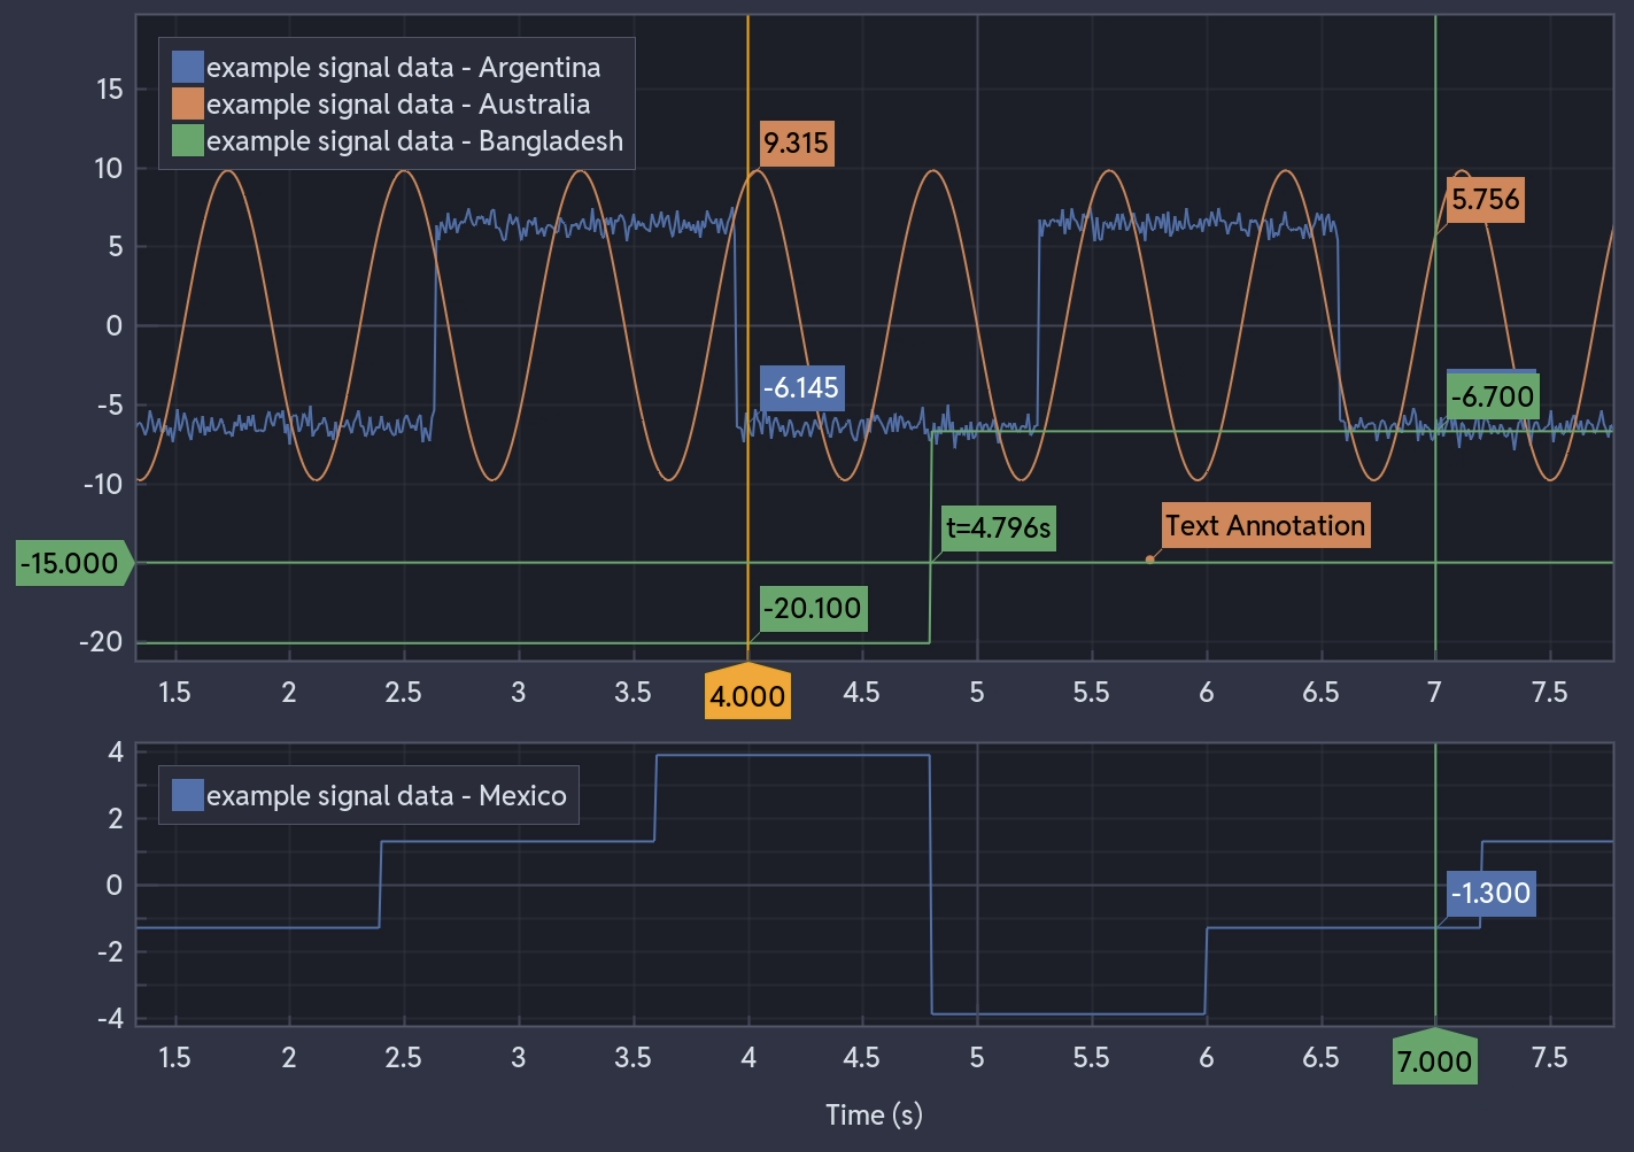
Horizontal Lines
- Mark a reference level, threshold or target value
- Span the full width of the subplot
- Detect where they intersect the plotted series
- Move vertically only when dragged
Vertical Lines
- Mark a point in time
- Span the full height of the subplot
- Move horizontally only when dragged
Linked Vertical Lines
- Mark the same time in every subplot at once
- Moving the line in one subplot moves it in all of them
- Drawn in the same colour and style throughout
Text Annotations
- Add a label, note or callout
- Move freely in both directions when dragged
- Editable after placement
Creating Annotations
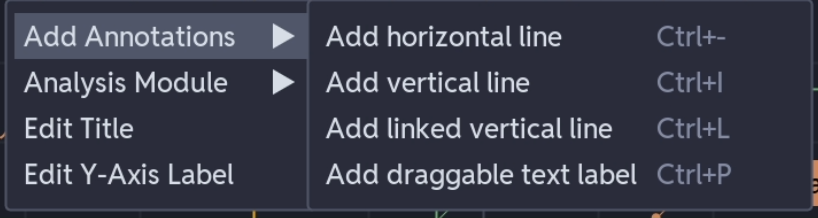
Right-click in any subplot → Add Annotations:
- Add horizontal line - placed at the cursor's Y position
- Add vertical line - placed at the cursor's X position
- Add linked vertical line - placed at the cursor's X position in every subplot
- Add draggable text label - placed at the cursor, ready for you to type
Interaction
Dragging
Hover over an annotation until the cursor changes, then click and drag it.
Context Menu
Right-click an annotation for:
- Delete: remove the annotation
- Edit text: change the content of a text annotation
Deletion
Right-click → Delete, or select the annotation and press Delete.
Colours
Annotations are coloured automatically.
Intersection Detection
Horizontal lines report where they cross the plotted series:
- intersections are recalculated as the line moves
- each intersection point is highlighted
- the time and value are shown at each intersection
- every series in the subplot is checked
Linked Vertical Line Details
- The line is synchronised across all subplots in the current plot tab
- Axis tags show the current time value and update as you drag