Settings & Configuration
This guide covers all the current configuration options for Cute Plot. Our aim with Cute Plot is to provide practical, usable defaults, but to allow for customisation if required.
Preferences
Open Settings → Preferences... for the main settings window, organised into sections on the left:
- General - query decimal places, screenshot folder
- Appearance - theme, and a separate theme for screenshots
- Files - date/time formats for parsing timestamps, and the lazy-load threshold (200 MB by default) above which a file loads on demand instead of all at once
- Plotting - downsampling amount, frame rate, and decimal places and date formatting for line tags
- Network - proxy settings for the licence server
- Misc - logging, background updates, and an experimental features toggle
Changes take effect on Apply Preferences.
Query Analysis Configuration
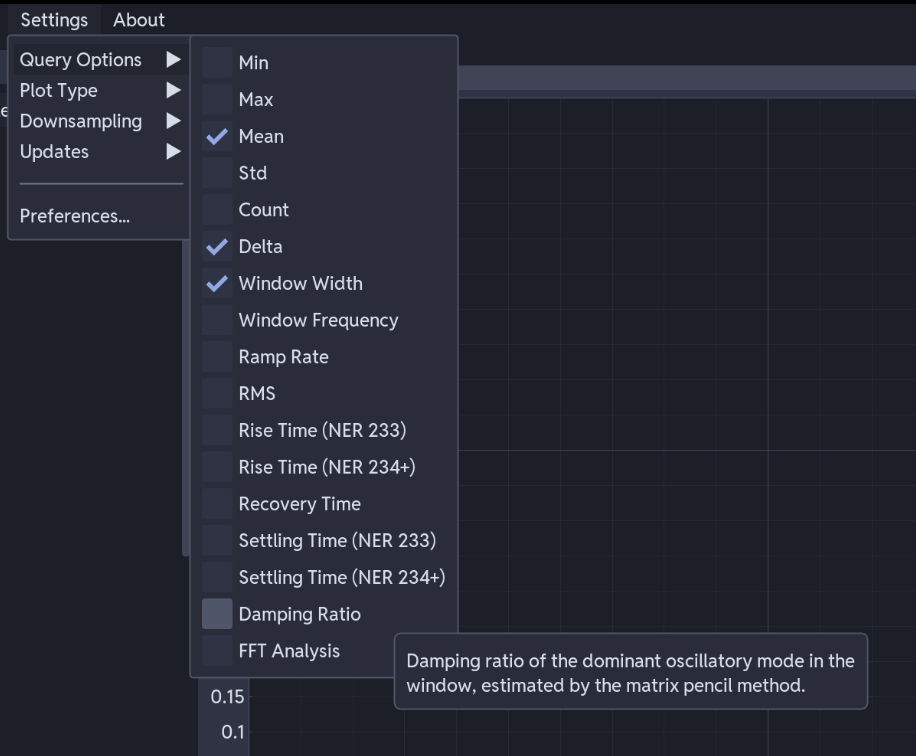
Open Settings → Query Options. Each statistic can be switched on or off independently; mean, delta and window width are on by default. The full list, with descriptions and defaults, is in Query & Analysis Tools.
The options are grouped as:
- Basic statistics: mean, delta, minimum, maximum, standard deviation, count
- Window measurements: window width, window frequency
- Signal analysis: ramp rate, RMS, FFT analysis (dominant frequency)
- Power systems metrics: NER rise time, recovery time, NER settling time, damping ratio
File Locations
Cute Plot keeps its settings in %USERPROFILE%\.cuteplot\:
| Path | Contents |
|---|---|
templates\ |
Saved templates, as .yaml files. See Templating System |
recent_templates.json |
Recently used and favourite templates |
preferences.json |
Settings from the Preferences window |
| Log files | Diagnostic output for support requests |
Troubleshooting
Resetting Configuration
Delete %USERPROFILE%\.cuteplot\ to return every setting to its default. This also deletes your saved templates and Preferences, so copy the templates\ folder elsewhere first if you want to keep them.